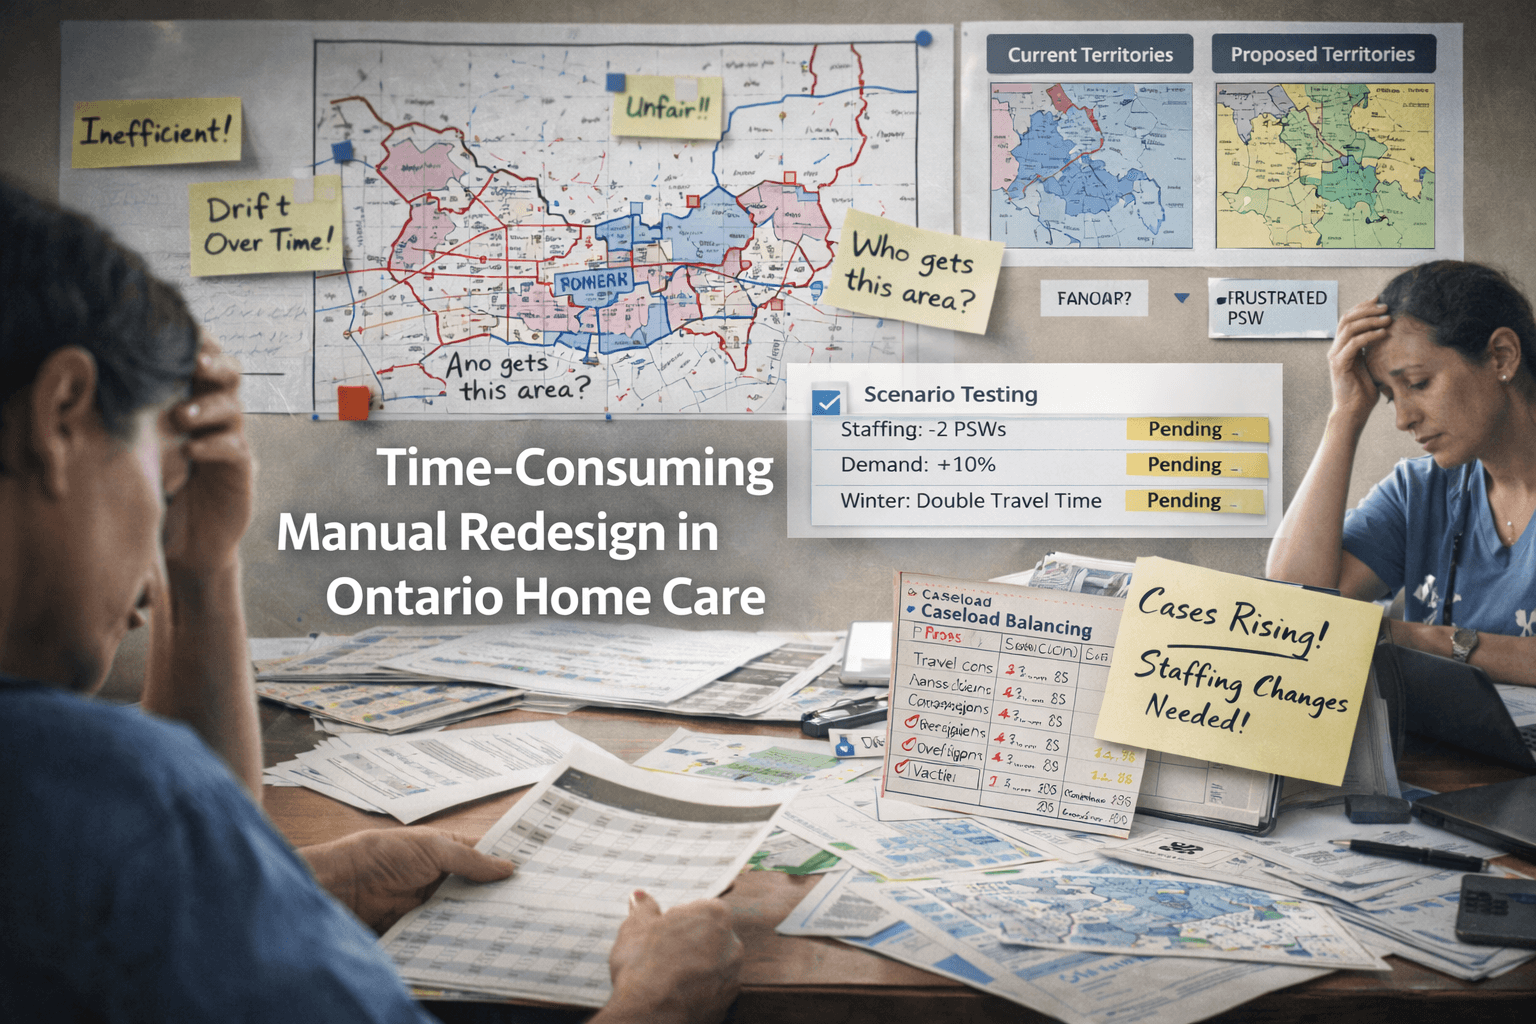
Most home care leaders already know the pain: caseloads drift out of balance, travel time creeps up, and the "fix" becomes a high-stakes manual exercise that takes weeks, creates anxiety, and still leaves people feeling it was unfair.
In Ontario, that approach is running out of runway. The aging wave is accelerating demand, while capacity and workforce constraints make it harder to absorb inefficiency. The uncomfortable conclusion is this:
If caseload redesign stays manual and infrequent, the system will keep drifting into crisis mode. Revealing the imbalance is hard. Fixing it is harder. Explaining the change is hardest.
Home care territory design is a districting problem, not an admin task
At its core, territory and caseload redesign is a districting problem:
- You start with small geographic units (postal areas, neighbourhoods, catchments).
- You must group them into a fixed number of caseloads.
- Caseloads usually need to be geographically coherent (often contiguous).
- Each caseload should be "fair" by workload, not just by client count.
- The plan has to survive real-world constraints like staffing, travel, cancellations, and client complexity.
This is exactly why spreadsheet approaches struggle. You are not solving one problem. You are solving many problems at once.
Why spreadsheets and tribal knowledge fail in Ontario's reality
1) Workload is multi-dimensional, but manual balancing is usually one-dimensional
A "balanced" caseload is rarely just equal client counts. In practice, balance should reflect:
- visit minutes (and number of visits)
- travel time between clients
- care complexity and physical intensity
- time windows and continuity requirements
- schedule volatility (holds, cancellations, sudden reassignments)
Manual redesign tends to overweight what is easiest to see on paper, and underweight what drives burnout in the field.
2) Drift is guaranteed when rebalancing is infrequent
Territories never stay stable:
- new developments change density
- client mix shifts toward higher acuity
- staffing changes alter coverage feasibility
- seasonal patterns change travel and visit timing
Even a "good" map becomes outdated. Without a repeatable rebalancing cycle, organizations get trapped in a pattern of waiting until things become painful enough to justify a disruptive redraw.
3) Contiguity and constraints create combinatorial complexity
Ontario home care organizations often need coherent geography to reduce travel and improve reliability. Once you add contiguity, plus "do not split" boundaries, plus minimum and maximum workload thresholds, the number of possible assignments explodes.
Manual redesign becomes a negotiation exercise because it is hard to prove that an alternative is better without running many scenarios.
4) Change management becomes the bottleneck
Even when leadership agrees the caseloads are unfair, implementing changes is difficult:
- frontline staff worry about losing familiar routes and clients
- unions and managers want clear rationale
- patients and families are impacted by continuity changes
- community partners want consistency and clarity
Ontario Health atHome's business planning explicitly frames the system as being in ongoing transformation and modernization, requiring adaptability and innovative solutions, while also calling out the need for change management planning to support staff through transition. (Ontario Health at Home)
That is the point: it is not only about finding a "better" map. It is about being able to explain the map, defend it, and implement it with minimal disruption.
Why the problem is getting worse right now
The senior surge is steepest in the near term
Home Care Ontario's 2024 analysis projects Ontario's 65+ population growth rate will be about 3.5% per year in the next five years, and the 75+ cohort will grow about 4.1% per year over the next 5 to 6 years.
It also projects that over the next six years, Ontario's 65+ population will increase by 650,000 people, and by the end of 2029 there will be about 350,000 more people aged 75+.
More seniors plus more complexity means more demand, and more demand means less tolerance for inefficiency.
Capacity is not clearly rising relative to need
That same Home Care Ontario summary cites FAO context that despite population growth, the number of Ontarians receiving home care has been flat in recent years at roughly 480,000, and that nursing and personal support service hours per Ontarian aged 65+ have been declining.
Separately, the FAO's health sector materials state that for home care, annual nursing and personal support hours per Ontarian aged 65+ will be approximately the same in 2024–25 as in 2019–20, implying no meaningful improvement in capacity relative to need. (Ontario Financial Accountability Office)
When demand grows quickly and capacity per senior stays flat, operational allocation becomes a major lever.
Even "status quo" service levels require major workforce growth
Home Care Ontario's analysis estimates that from 2024 to 2029, Ontario's home care sector would need an additional 6,800 PSWs just to maintain current service levels.
So the system needs hiring and retention, but also needs to stop wasting the capacity it already has.
The scale of Ontario home care makes manual redesign brittle
Ontario Health atHome's 2024–2025 business plan notes it supports approximately 344,560+ patients every month, and 651,850+ patients each year across the province. (Ontario Health at Home)
At that scale, small inefficiencies become big numbers:
- 5 minutes of extra travel multiplied across thousands of visits
- pockets of overload that trigger sick days and attrition
- inconsistent assignments that reduce continuity and trust
Looking at this as "just scheduling" misses the point. The map is the system.
A long-standing call for modernization
Ontario's Auditor General has repeatedly flagged that how home care services are organized and delivered needs to be revisited. In the 2015 special report on CCACs, the Auditor General concluded that the way CCACs operate and deliver services needs to be revisited. (auditor.on.ca)
Governance structures have evolved since then, but the operational challenge remains: how to allocate care fairly and reliably across geography, with constrained workforce capacity.
What "better" looks like: operational districting you can repeat and defend
If you want territory and caseload redesign to stop being a crisis project, it needs to become a repeatable operational function.
1) Define a workload metric that reflects reality
Start with something simple, then evolve it:
workload = visit minutes + travel minutes + complexity weight + volatility buffer
This prevents "balanced on paper, brutal in practice."
2) Shift from one big redraw to smaller, frequent rebalances
Smaller changes are easier to absorb, easier to explain, and reduce drift.
3) Make it scenario-driven
Leadership needs fast answers to practical questions:
- What if we lose two PSWs in a zone?
- What if winter travel doubles in rural pockets?
- What if a new long-term care home opens and changes discharge patterns?
- What if we must keep specific communities intact?
Manual methods are slow at answering "what if." Tools should make that cheap.
4) Make it explainable for change management
Every redesign should produce:
- what moved and why
- who is impacted (staff, clients)
- before and after workload and travel deltas
- a defensible rationale you can share with frontline teams
If you cannot explain it, you cannot implement it.
A quick self-check: 7 signs your territories are breaking down
If you see several of these, you are likely experiencing districting drift:
- Frequent last-minute reassignments to "patch holes"
- Some PSWs consistently carry the hardest routes
- Travel time keeps rising quarter over quarter
- Coverage issues cluster geographically
- Caseload fairness complaints increase after staffing changes
- Rebalancing is delayed because it is "too disruptive"
- Your organization cannot clearly quantify imbalance and improvement
Closing thought
Ontario's aging curve means home care demand will grow fast, and the system cannot afford to allocate capacity inefficiently. Manual, infrequent redesign cycles were already hard. Now they are becoming structurally mismatched to the pace of change.
Modernization is not only policy and funding. It is also the ability to measure imbalance, run scenarios, rebalance safely, and explain changes clearly.
References
- Home Care Ontario, Kralj & Sweetman (Feb 2024): The Impact of Ontario's Aging Population on the Home Care Sector (senior growth rates, flat home care client counts, declining hours per senior, PSW needs).
- Financial Accountability Office of Ontario: Ontario Health Sector: Spending Plan Review presentation (home care hours per Ontarian 65+ roughly same in 2024–25 as 2019–20). (Ontario Financial Accountability Office)
- Ontario Health atHome (Home and Community Care Support Services): Business Plan 2024–2025 (scale, modernization context, change management). (Ontario Health at Home)
- Auditor General of Ontario (Sept 2015): Special Report: Community Care Access Centres, Financial Operations and Service Delivery (need to revisit operations and service delivery). (auditor.on.ca)