Home care operators usually feel the strain first as staffing, missed visits, overtime, and scheduling chaos. But there is another lens that matters for leadership and finance: non-optimal caseload design quietly destroys capacity, and capacity is the upstream driver of both revenue and margin.
Ontario's scale makes this painfully real. Ontario Health atHome coordinates a system that delivers 100,570+ PSW service hours per day and purchases $2.7B of services from providers across roughly 400 contracts. (Ontario Health at Home)
So even small efficiency losses become material dollars.
The three biggest sources of "revenue leakage"
1) Travel time eats the workday
In Toronto's home care sector, one study found average travel time of 5.5 hours per week for home support workers, and that travel is often underpaid or unpaid.
That time is not delivering care. If you can reduce travel by tightening geographies and smoothing routes, you often convert some of that time into additional visits or hours.
2) Missed care is direct lost volume (and often a contract risk)
Ontario tracks "missed care" as service not provided in accordance with the care plan due to missed visits or lack of capacity. In one Ontario system report, the provincial missed care rate for PS services was 0.48% (March 2023) versus a target of 0.054%. (Home Care Ontario) Ontario Health atHome's business plan also reports a similar order of magnitude (for example PSS 0.443% in FY 23/24 Q2). (Ontario Health at Home)
Even if your contract is not pure fee-for-service, missed care can still show up financially via under-delivery, higher admin burden, and future procurement or performance pressure.
3) Split-shift gaps reduce usable capacity and retention
The same Toronto report found an average of 2.6 hours per week of unpaid work (about 10% of weekly hours), and describes long unpaid gaps between visits that "occupy the day" but pay like part-time work.
From a business view, these gaps reduce the number of "convertible" hours you can actually schedule into delivered care.
A simple model you can run in 10 minutes
Step 1: Estimate your "recoverable hours"
Pick conservative improvement targets:
- Travel-time reduction from better geographic clustering:
TravelHoursSaved = WeeklyTravelHours × TravelReduction% - Missed-care reduction from better staffing alignment and load balancing:
MissedHoursSaved = AnnualDeliveredHours × (CurrentMissedRate - TargetMissedRate) - Gap reduction (optional if you measure it):
GapHoursSaved = WeeklyGapHours × GapReduction%
Then apply a realism factor (you rarely convert 100% of saved time into delivered care):
ConvertibleHours = (TravelHoursSaved + GapHoursSaved) × Conversion% + MissedHoursSaved
Step 2: Convert hours to dollars
Use a rate that matches your commercial reality:
- Publicly funded environments and contracts vary, but historical Ontario auditing found personal-support service charge rates like $29.50 to $48.98 per hour in different areas. (Office of the Auditor General of Ontario)
- Private-pay PSW rates are often cited around $28 to $35 per hour. (ConsidraCare)
RevenueOpportunity = ConvertibleHours × RealizedRatePerHour
Worked example: a mid-sized provider
Assume:
- 250 PSWs
- Weekly travel time per PSW: 5.5 hours (use your own data if you have it)
- Travel reduction from better caseload design: 15%
- Conversion of saved travel into delivered care: 60%
- Annual delivered PSW hours: 500,000
- Missed care improvement: from 0.48% to 0.054% (system target) (Home Care Ontario)
- Realized rate: $35/hour (example)
Travel capacity unlocked
- Saved travel per PSW per week:
5.5 × 0.15 = 0.825 hours - Across 250 PSWs:
0.825 × 250 = 206.25 hours/week - Convertible at 60%:
123.75 delivered hours/week - Annualized:
123.75 × 52 = 6,435 hours/year - Revenue:
6,435 × $35 = $225,225/year
Missed care recovered
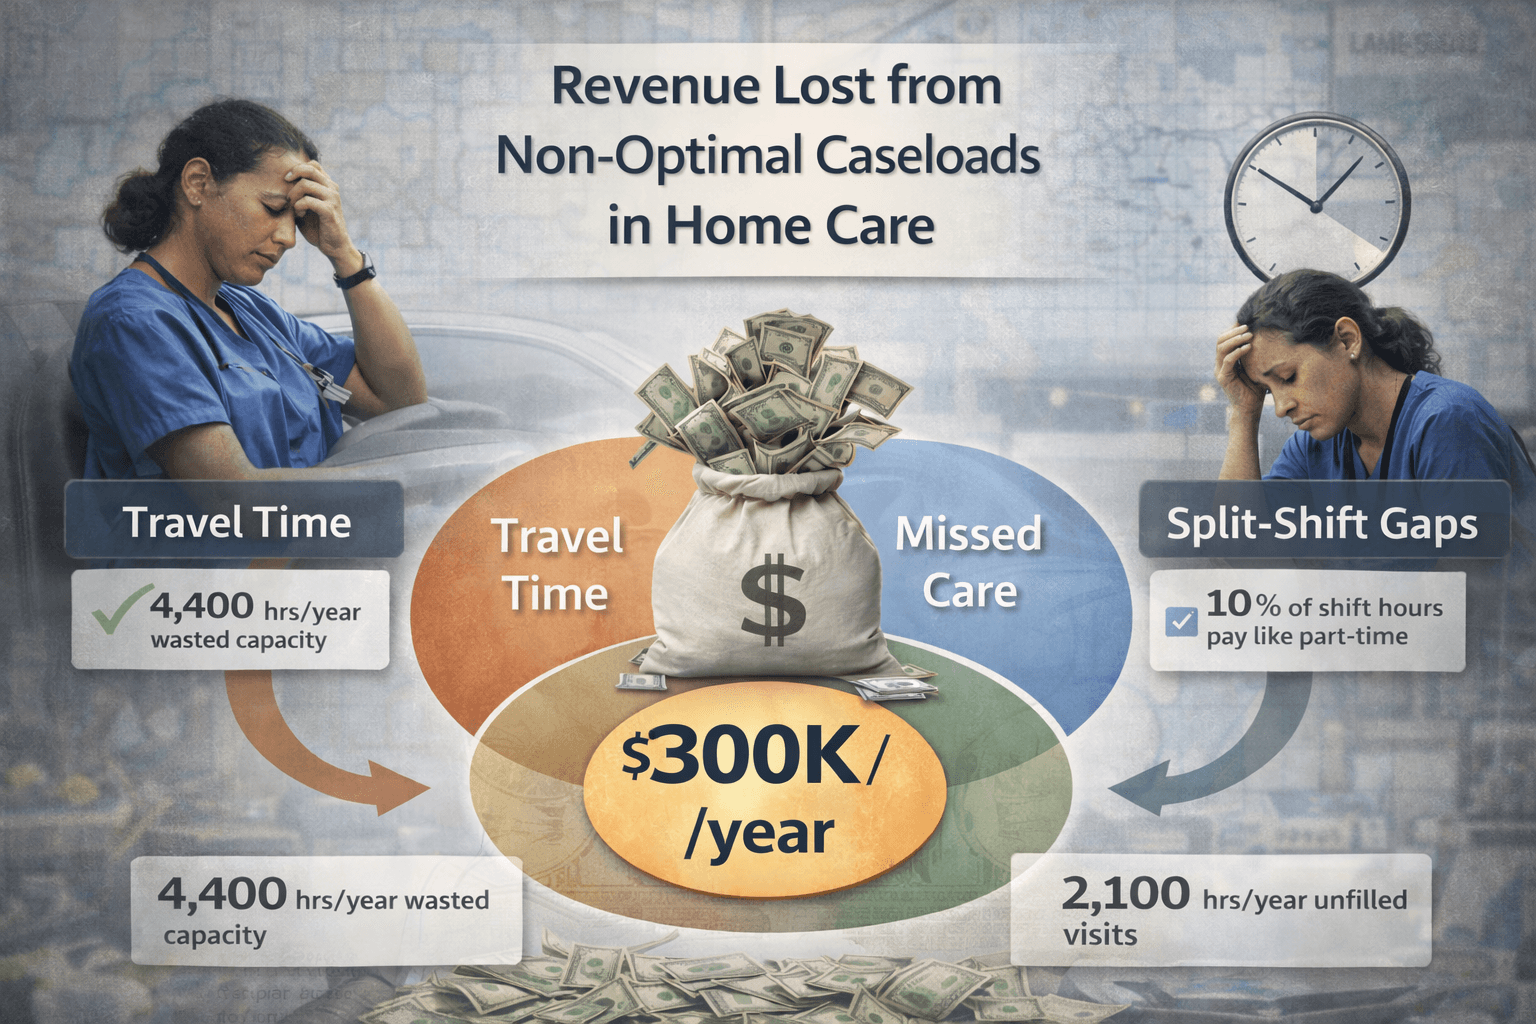
- Saved missed hours:
500,000 × (0.0048 - 0.00054) = 2,130 hours/year - Revenue:
2,130 × $35 = $74,550/year
Total opportunity (conservative): about $300K/year in incremental revenue potential, before considering overtime reduction, reduced supervisor time firefighting, or retention impact.
If your realized rate is higher (or you are capacity-constrained and turning away referrals), the opportunity scales quickly.
What to measure in your organization
If you want to quantify this credibly (and make it board-ready), track these five numbers monthly:
- Delivered hours (PSW, nursing, therapy)
- Travel time per shift (average and distribution)
- Gaps between visits (minutes of idle time during scheduled availability)
- Missed care rate (hours and root causes)
- Unfilled demand (referrals waiting, waitlist growth, declined cases due to capacity)
Ontario Health atHome explicitly tracks missed care and access metrics like wait times and incidents where visits were not completed. (Ontario Health at Home)
Why caseload configuration is the lever
Hiring and funding matter, but they take time. Caseload design is one of the few levers that can improve capacity inside existing constraints by reducing unnecessary travel, smoothing workloads, and making schedules more predictable.
That is not just better care delivery. It is a business-line advantage: more delivered volume, lower chaos cost, and a clearer operational story for leadership, funders, and partners.
References
- Ontario Health atHome, Business Plan 2024–2025 (daily PSW hours, purchased services, performance indicators). (Ontario Health at Home)
- Home Care Ontario, Maintaining Stability and Growing Personal Support Capacity in Ontario's Home Care System (missed care rates and targets). (Home Care Ontario)
- Social Planning Toronto and Dr. Naomi Lightman (TMU), Caring About Care Workers (travel time and unpaid hours estimates; travel and split-shift impacts).
- Office of the Auditor General of Ontario, Special Report: CCACs Financial Operations and Service Delivery (illustrative hourly rate variation for personal support services). (Office of the Auditor General of Ontario)
- ConsidraCare, How Much Does Home Care Cost for Seniors in Ontario? (private-pay PSW rate range, illustrative). (ConsidraCare)